
StatPecker
Transforms raw data into engaging visuals for presentations and reports. Ideal for businesses and educators looking to enhance their communication. Free to use, making it accessible for all users.
StatPecker — official website
Imagine you’re a data analyst tasked with compiling quarterly reports for your company. Your team relies heavily on these reports to make informed business decisions, and you’ve just been informed that the presentation is due at the end of the week. The problem is that your data is complex, and creating visuals to effectively communicate the insights is time-consuming. You need an efficient tool to convert raw data into understandable and engaging visuals quickly. In situations like these, a tool that specializes in transforming data into presentation-ready visuals would be immensely helpful.
Based on its own marketing, StatPecker excels in transforming raw data into engaging visuals, which can be particularly useful for presentations and reports. If you’re looking to enhance communication without the hassle of designing visuals from scratch, this tool seems to offer a streamlined solution. You upload your raw data and StatPecker processes it to generate visuals that can be directly incorporated into your presentations. The tool’s free access ensures that you can leverage its functionalities without worrying about budget constraints, making it an attractive option for businesses and educators alike.
Key Features
- Data to Visuals Transformation — Converts raw data into easy-to-understand graphics and charts, crucial for clear communication in reports and presentations.
- Business Analytics Integration — Facilitates the analysis of complex data sets, enabling users to derive actionable insights.
- Collaboration Tools — Supports team collaboration, allowing multiple users to work on projects simultaneously, enhancing productivity.
Pros & Cons
- ✓ Completely free to use, making it accessible to individuals and organizations with tight budgets.
- ✓ Ideal for educators and business professionals needing to enhance communication through visuals.
- ✓ Facilitates collaboration, supporting teamwork in data-driven projects.
- ✗ The website doesn’t specify if there are advanced customization options for the visuals.
- ✗ May not integrate with certain niche data sources or platforms not mentioned in their marketing.
If you’re a graphic designer looking for highly customizable design options, StatPecker might not meet your needs. The tool focuses on converting data into straightforward visuals, so if your workflow requires intricate design elements or brand-specific customization, you could find it limiting. Its strength lies in simplicity and accessibility, which might not align with more advanced design requirements.
In the realm of data visualization tools, Tableau and Google Data Studio are popular alternatives. Tableau offers robust analytical capabilities and is well-suited for organizations with complex data needs, but it comes with a cost. Google Data Studio, on the other hand, is also free and integrates well with other Google tools, making it a good choice for users already within that ecosystem. StatPecker is ideal for those who need a straightforward, no-cost solution for turning data into visuals without the need for deep analytical features.
Best For
StatPecker is best for small business owners, educators, or independent researchers who need to create polished visuals from data without spending on expensive software. Its completely free pricing model makes it accessible for users who want to enhance their presentations and reports efficiently.
StatPecker is a solid choice for those who need a simple, effective tool to convert data into visuals at no cost. It’s particularly suitable for educators and business professionals looking to enhance communication through engaging presentations. If you’re searching for a user-friendly tool to streamline your data visualization process, StatPecker is worth considering.
This review is based on publicly available information from the tool's official website and is written independently by the theWebrary editorial team. We do not accept payment for review content.
Share
Tool Overview


Browse More Tools
View all
Tokens Forge
AI Developer ToolsTokens Forge is a low-cost AI model token platform and OpenAI-compatible API gateway for GPT, Claude, Gemini, and routed model pools. Users can create one API key, manage usage and billing in one dashboard, and use backup routes without maintaining multiple provider accounts. It also includes an AI Researcher workflow for market and company research reports.
Lighthouse Careers
AI ProductivityConnects yacht crew and private staff with job opportunities in superyachts and luxury estates. Trusted by over 500 clients, it offers same-day candidate matches and a free replacement guarantee, all at no upfront cost.
Goglobal
AI MarketingAutomates Reddit marketing to help users post safely, build karma, and avoid bans. Trusted by founders and growth teams, GoGlobal offers a free version with options for paid upgrades.
Zilla Marketplace
E-commerce AIBuy and sell vehicles, real estate, and local goods across the United States on Zilla Marketplace. This platform connects users with a diverse range of listings, from premium vehicles to high-quality local products. Access is free, with options for paid upgrades to enhance features.
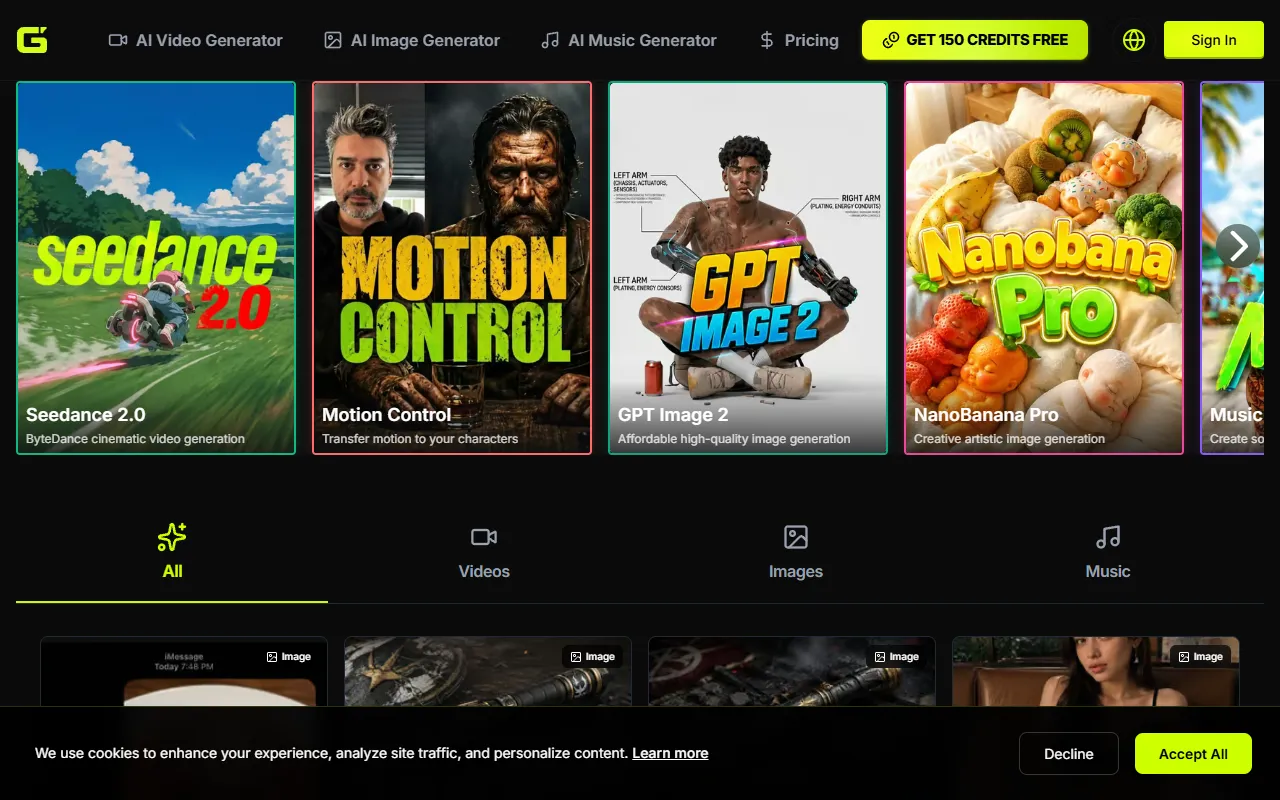
AI Video Generation
AI VideoGenerate high-quality videos, images, and music using advanced AI models. Ideal for creators seeking watermark-free content, this service offers free credits to get started without requiring a credit card.
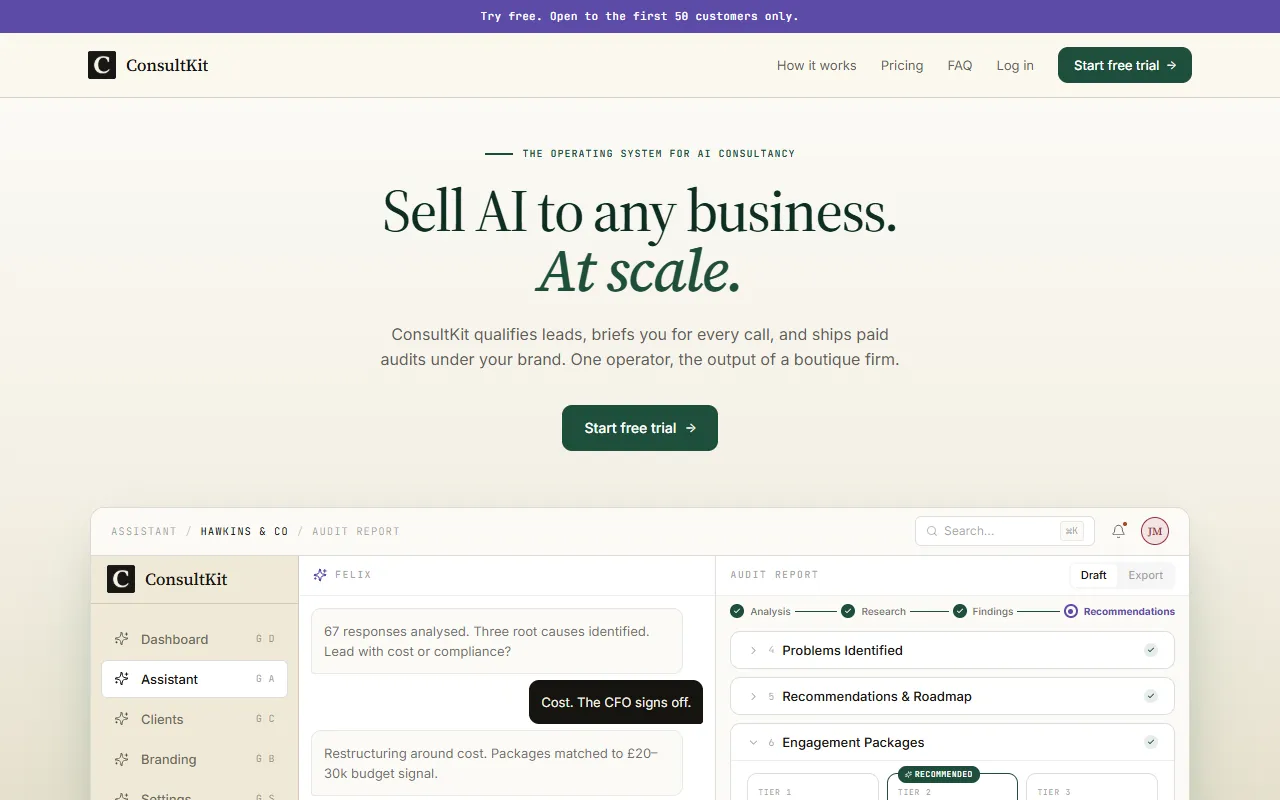
ConsultKit
AI FinanceQualifies leads and prepares consultants for client calls by providing tailored strategies and audit reports. Ideal for businesses looking to sell AI solutions at scale. Free for the first 50 customers.
Get Your AI Tool
In Front of Thousands
Join hundreds of AI tools already featured on theWebrary. Get priority placement, a dedicated listing page, and reach an audience actively searching for AI tools.
1 Month
$5
$6
3 Months
$10
Save 50%
12 Months
$20
Save 75%